analytics

Wednesday, December 30, 2015

Parameterized Quadratic Conformal transformation

Q(s,t)


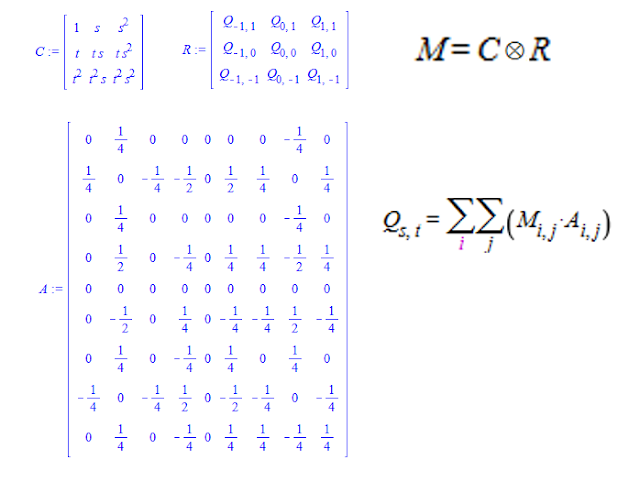
Note that the same formula applies first to the x coordinates, and then to the y coordinates and can work in any number of dimensions 2 or greater, Imagine that Q can be any of X, Y, Z component axis, and s and t vary continuously from -1..1... I'm not sure if there might be a notation using summations or matrices that makes this simpler and nicer to write, but maybe it's not that big of a deal when you can just write Q(s,t) to mean this in other formulas... It can also be fairly easily extended to volumes or higher dimensional objects using more variables than just s and t....

It's derived from my earlier post on the E_Bezier:
http://benpaulthurstonblog.blogspot.com/2015/12/ebezier.html...

One can derive something in a similar way from regular Beziers but then the mapping isn't conformal...

I made s and t vary from -1..1 so they can shrink to -delta +delta around a point on surface F for a sort of surface approximation, it can be shown that as delta shrinks to 0 in the limit the result is F at that point..Or to make the Q values closer and closer to surface F at a point to get a sort of parameterized surface derivative or tangent surface ( I think! I might explore that in a later post)... Also parameterization is a natural fit for conformal mappings because they are both scale and translation-invariant (also rotation)... A rectangle under a conformal mapping can be achieved by adding a coefficient multiplying one of or both t and s,.

I think maybe General Relativity might be simpler rewritten with this type of formula in mind, because it seems like the complicated thing is keeping all the axis components sorted out whereas this you can do each variable individually with the same formula, just a guess though I don't know that much about General Relativity...

**Matrix version**


Or using matrices instead of the row and column vector and the tensor product:


**Python Program**

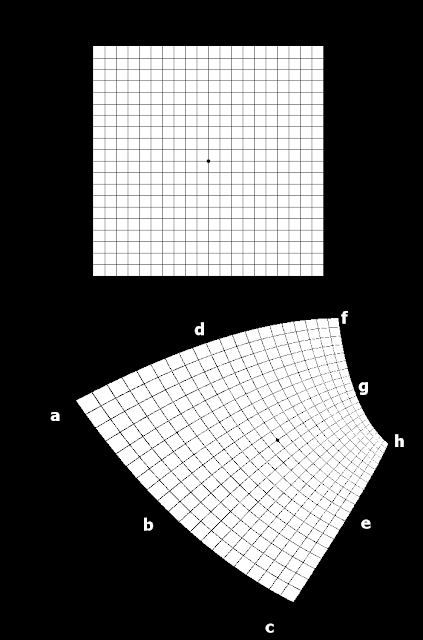
It's more convenient to use a bit different formula when doing things with computer images, ... It's the function q in the program below and the program takes any image of any size and maps it according to the following, there's also a variable for a value for oversampling; this one below is 2*x oversampled...: This map was actually made with the program, you can see the grid lines only ever cross at right angles, that's the conformal property...

**Python Code listing (using Pillow for python)**

from PIL import Image

def q(s,t,a,b,c,d,e,f,g,h):
    p = 1.0*((1/4)*b-(1/2)*s*b+(1/2)*s*s*b+(1/2)*t*t*d+(1/2)*t*d+(1/4)*e+(1/4)*g+
             t*t*s*s*((1/4)*g+(1/4)*b+(1/4)*d+(1/4)*e)-(1/2)*t*t*s*g+(1/2)*s*s*g+
             (1/2)*s*g-s*s*((1/4)*g+(1/4)*b+(1/4)*d+(1/4)*e)-t*t*((1/4)*g+(1/4)*b+
             (1/4)*d+(1/4)*e)-(1/2)*t*t*s*s*e+(1/2)*t*s*s*e+(1/4)*t*s*f+(1/4)*t*s*s*f+
             (1/4)*t*t*s*f+(1/4)*t*t*s*s*f-(1/4)*t*t*s*c-(1/4)*t*s*s*c+
             (1/4)*t*t*s*s*c+(1/4)*t*s*c-(1/2)*t*t*s*s*g-(1/2)*t*e+(1/2)*t*t*e-
             (1/2)*t*t*s*s*b+(1/2)*t*t*s*b+(1/4)*d-(1/2)*t*s*s*d-(1/2)*t*t*s*s*d+
             (1/4)*t*t*s*s*a-(1/4)*t*s*a-(1/4)*t*t*s*a+(1/4)*t*s*s*a-(1/4)*t*s*s*h+
             (1/4)*t*t*s*s*h+(1/4)*t*t*s*h-(1/4)*t*s*h)
    return p

def main():
    grid = Image.open("grid.png")
    output = Image.new("RGB", [700, 1200])
    w, h = grid.size[0], grid.size[1]
    c = [[116, 724],[288,926],[477,1059],[354,622],[579,897], \
         [552,588],[582,717],[634,796]]
    print(w,h)
    oversample = 2
    for i in range(0, oversample*w):
        for j in range(0, oversample*h):
            
            s = (2.0/w)*(i/oversample*1.0)-1
            t = -((2.0/h)*(j/oversample*1.0)-1)
            color = grid.getpixel((i/oversample*1.0,j/oversample*1.0))
            px = q(s,t,c[0][0], c[1][0], c[2][0], c[3][0], c[4][0], c[5][0], c[6][0], c[7][0])
            py = q(s,t,c[0][1], c[1][1], c[2][1], c[3][1], c[4][1], c[5][1], c[6][1], c[7][1])
            px = int(px)
            py = int(py)
            try:
                output.putpixel((px,py), (color, color, color))
            except:
                print((i,j), (px, py))
    output.save("conformal.png")
main()

**Chaining q(s,t)**

It's also pretty straight forward to chain for example a seamless texture to make a warped texture band...


Tuesday, December 29, 2015

Interesting non-regular pentagon

Questions for further study: Can you tile the plane with these? Are the angles inside the points of the star the same? Is the center pentagon made by the star regular?

Sunday, December 27, 2015

Tr(n)^2+Tr(n+1)^2=Tr((Tri(n) + Tri(n+1)) for triangular numbers

I found this about the triangular numbers, also known as the number of distinct pairwise combinations of n items or the sum of the first n of 1,2,3,4,... this wasn't listed on the Encyclopedia of Integer sequences... , The formula for a triangular number is:

I found that:


Provable easily by substituting the formula for Tri in each side:

Tuesday, December 22, 2015

MacLaurin Generating Function

Exponential generating functions follow the form:
I was considering a modification of this structure to read:

Where f_n_(x) at x is both the sequence of coefficients to find the generating function for and the nth derivative at x following the convention of the MacLaurin Series for a function...
If we call this a MacLaurin Generating Function, then we can get some interesting series at x=1...


It continues after 0,1,2,3 with 8,10,54... and I've just learned that these are the Lehmer-Comtet numbers: Lehmer-Comtet

Now we can see what other of these types of series might have simple MacLaurin generating functions, below is if you use x^(2*x)

Maybe not as complicated as it looks when you substitute in x=1 that last 7th derivative is:
Still pretty complicated but the non power of 2 numbers look to be related to multiples of factorials?

The series 1, 2, 6, 18, 64, 220, 888 is not in the Encyclopedia of Integer sequences, but looks interesting! In fact Alois P. Heinz has already pointed out that the exponential generating function for x^2*x is x^2*x itself!


Factorial sum Maple doesn't know

Considering the sum:
But it's clear this sum should be equal to one, consider the first 7 terms:
If we were to increase the last coefficient by 1 it is exactly unity:
This is because 8/8! is 7! which adds one more 7! to 6/7! to make 7/7! which is 6!, etc.. until you have 1/2! plus 1/2! equaling 1...

It's kind of interesting to think what function would have this as it's MacLaurin series, that at f=1 it is 0, and the first derivative there is 1, and every successive derivative is 1 more than the one before it...
It actually is (x^x)-1, see:

Alternate numbering system

Just considering this series, here are the first 9 terms:
Where the next coefficient is chosen so the sum is as large as it can be not exceeding 1... The growth of the coefficients  can be solved for by noting the next term should by multiplied by some a so that it is as large as the previous term when it has a coefficient of 1...

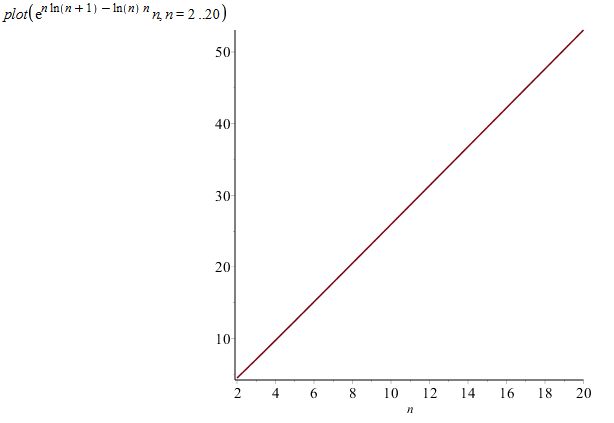
Plotted it is linear:
So I've noticed that this series is basically as efficient for writing any number between 0 and 1 with regards to number of decimal digits as decimal itself is! By the pigeon hole principle no series can be better for getting k decimal digits than the decimal series a1/10 + a2/100...

Thursday, December 17, 2015

Quadratic rule of eighths

This follows simply by substituting 1/4 and 3/4 into the E_Bezier formula from last post...

Saturday, December 12, 2015

E_Bezier

Normally the quadratic Bezier through three points A,B,C is:
I found an alternative that has some nice properties I'm calling the E_Bezier also through points A,B,C:

Both the Bezier and the E_Bezier are defined over the interval t=0..1, and equal A at t=0 and C at t=1, but the E_Bezier has the property that at t=1/2, it equals exactly B, which is not the case for the Bezier curve...

The acceleration of the E_Bezier curve is exactly double the acceleration of the Bezier curve...

I called it the E_Bezier because it spends "E" qual time between points A and B and points B and C...

**I might continue with an update for higher order than quadratic E_Bezier**

Wednesday, December 9, 2015

Balance scale series

Trying to get the least amount of elements in a series of natural numbers that can be combined by adding or subtracting unique elements of the series to get as many consecutive natural numbers as possible starting with 1. I came up with:

1,2,7, 21, 52
 For example
13=21-7-1,
14=21-7,
15=21-7+1, etc... Every natural number less than 84 can be reached by adding or subtracting these first 5 numbers...

The pattern I found is that x-sum(previous) = sum(previous)+1, solve for x, because the previous were able to reach every number up to sum(previous), and you need an x so that subtracting all of those numbers yields every number up to x...

This isn't in the Encyclopedia of Integer sequences yet, but I don't know if it's the best solution...
The name comes from the fact that on a balancing scale, you could weigh any natural number weight by putting the additions on one side of the balance and the subtractions and the object being weighed on the other...


Monday, December 7, 2015

Faster method than Newton-Raphson

This will be considering a replacement of the Newton-Raphson method for better performance changing:
to:

First recall that the Newton-Raphson method started as a generalization of the Babylonian method for finding square roots... I'll start the same way by showing this method speeds up finding square roots...

Starting with a reasonably close approximation to the square root of N such as the closest perfect square, one can first use this formula where x is the estimate.


For example with an N of 61, we can chose x to be 7 because 7^2=49 is close to 61 and then:


Now recursively use the formula again:


Which is very close to the square root of 61 compare:


After 2 iterations it's already accurate to 9 decimal places! Two iterations of the Newton Raphson method with the same initial conditions only correctly estimates 3. In fact it is better than 3 iterations of Newton-Raphson by a couple of decimal places...There are 7 arithmetical steps per iteration of this method and 5 for Newton-Raphson, so two iterations of this method take 14 arithmetic steps and get a better result than when Newton-Raphson takes 15 arithmetical steps, and Newton-Raphson would need 20 arithmetical steps to improve upon two iterations of this method... I think the difference becomes more marked when extreme accuracy is needed or when just the amount of accuracy that this method gives over Newton-Raphson is needed... And of course when very many of these calculations are needed...


So for another example if f(x) is 2*e^(x)-3 starting with a guess of .5 and doing two iterations we get:

That is very close to the actual root of:
Three iterations of Newton's method only correctly gets 5 decimal places right for more arithmetic...


Wednesday, December 2, 2015

Possible commutative pairing function

My conjecture is that given a,b positive integers:

is a positive integer unique to the pair a,b except for exchanging a and b...

I tried proving it a few different ways but really I don't know why it seems to work. I looked at many examples where it holds and usually there are 3,6,9, or 12 solutions over the integers but except for a,b and b,a one of the two integers is always negative...  Maybe the proof is simple, if 12 is the most solutions there can be and you know two solutions will both be negative integers, and 8 will have 1 negative and 1 positive integer, that only leaves two to be positive, but I wasn't able to get to that... Maybe also there's an argument from the symmetries that have to exist, I don't know...
For 3,4 the solutions are:


Friday, November 27, 2015

Distribution decomposition with normal curves

The formula I found to decompose a distribution into normal components, similar to how the Fourier transform decomposes a wave into sine and cosine components is:
Where n is the number of points to be interpolated... So if we know the value of the distribution say at x=1, 2, and 3 we evaluate the above with n=3 and those values for x1, x2, x3:

Now we can evaluate the above at each of x=1,2,3, with our y values of let's say .9, .7, and .8 respectively, and solve:
Now we can plot the solution:


Sunday, November 22, 2015

Preference Wheel on the complex plane

This example is for giving a person the task to rank their 3 favorite choices out of 10 possible choices labeled alphabetically... The data is as follows:

The above data means the first person chose their favorite to be choice e, their second favorite to be choice d, and their third favorite to be choice b... And the second person chose their favorite to be choice i, and their second favorite to be choice g, and their third choice was b... Etc...

So I thought to make a preference chart where a person's 3rd favorite always comes halfway between their first and second favorite on a circle... First I solved these equations:


In complex numbers on the unit circle this is saying the variable in the right hand side of each equation is the point on the circle halfway between the two variables on the left hand side around the circle... And the last equation a=1 is to disallow rotational symmetry we set one variable to equal the real axis...

There were quite a few solutions, but most were trivial that all the variables equal 1 or 0 or all real number solutions, the two interesting ones are mirror images across the real axis, one of them is:


Which plotted on the unit circle is:
And see that it encodes the information perfectly for example that f is halfway around the circle between j and e, when two variables are equal the halfway point is either equal to either or on the opposite side of the circle..

So once plotted the question is can we extrapolate that someone who listed, for example, a and e as their first two favorites, which was not information given, will usually like h as a third choice... I'll have to find a real dataset to statistically determine whether that is the case or not...

Thursday, November 19, 2015

Multidimensional projections on 2d plane

For 3 dimensions you can imagine that A,B,C are your 3 dimensional axes turned in such a way that looking at them they appear like this:
Define a point P on the plane to be P=a*A+b*B+c*C, with a,b,c values from the sliders...

Then we can look at all the ways to fix 2 of the sliders at 1 or 0 and move the 3rd, and tracing the paths they make gives:
Which is the "shadow" or projection of the 3d cube on the plane...

Now what if we have four orthogonal axes, so that their projection on the 2d plane looked like this:
We can define P to be P=a*A+b*B+c*C+d*D
There are a lot of ways to hold all but one of the sliders fixed at 1 or 0 and move the other one, doing so traces this onto the plane:
This is the projection on the plane of a 4 dimensional cube!