
Monday, October 28, 2013
Rotating linear force
If you made two gears that were parabolas, as one rolls over another a straight line force on one end can multiply the force and rotate it 45 degrees...

Sunday, October 13, 2013
Double centroid line regression
I thought of this way to do a regression of points that is much simpler than the least squares approach, as that involves using the derivative to find a minimal arrangement.
First you have your data points:
 Step 1: Find the centroid of the points. This is just averaging the x values and y values of all the points. There are 8 points here so I would add all the x values and divide that sum by 8, and add the 8 y values and divide by 8, to get a point x1, y1.
Step 2: Find the centroid of every point with an x coordinate greater or equal to x1. Here there are 6 points on the graph to the right of x1,y1. So I would sum the 6 x values and divide by 6 and sum the 6 y values and divide by 6. This gives x2,y2.
Step 3: Create the line connecting x1, y1 and x2,y2. Line(T)=x1*(1-t)+x2*(t), y1*(1-t)+y2*(t), for t from a to b, you can choose a and b to make the line as long as you want.
This gives C:

Theorem: This line C has the shortest total of distances squared to the points as measured by the length squared or quadrance of segments from C to all the points, each perpendicular to C.
Proof: Mirror all the points across C making pairs of points adding new points as necessary, C is still the line of balance because the midpoints of all those pairs still lie on C. This doubles the total distance squared to all the points. Then move every point so they all have the same distance squared to C as the average distance squared to C, this doesn't change the total distance squared and C still balances the points because the midpoint of every pair hasn't changed. For every pair of points, the distance to each from C is the same: a. This minimizes the sum of the distances squared to the two points , because if move the midpoint that is on C, to still balance the points it must be on the line connecting the two, but if we lengthen one distance and decrease the other both by c, to maintain the total distance, we have
(a+c)^2 + (a-c)^2 > 2*a^2
because
a^2+c^2+2*a*c + a^2+c^2-2*c*a > 2a^2
because
2(a^2 + c^2) > a^2
for any choice of c .
So since we can only increase the sum of the distances squared to C in this way, the point on C minimizes the distance squared to each pair of points, which means it minimizes the distance squared to any subset of these points because they all have the same distance squared to C. And the original points are a subset of these points so C minimizes the sum of the distances squared to them.
Comparison to Least squares method on sample data
On here is using Maple's least square method vs. the data:
 Maple said the linear function should be -.762*x+1/1000.
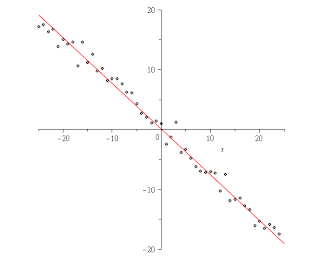
Here is using this method I made:
 My method said the function should be .76*x + .15 (after solving the parametric equation it yields for y in terms of x). So the solutions are both really close but mine ended up a little closer to the function I used to generate the data, I used .75*x+.25 and then added a random amount by picking a random number from a normal with mean 0 and variance 1.
The advantage to using mine versus the standard is that mine is simpler to compute running in linear time vs. the standard method has to solve a matrix which can run in somewhat less than O(n^3) time, so it is much faster taking only the cube root of n as much time. My method doesn't require the points to be one to one with the x-axis, and because it uses a parametric equation the best fit to the data could even be a vertical line whereas that would break the usual method. The axioms needed to use my method are simpler to explain as they only involve basic geometrical ideas and not calculus. And at least in this one test it gave a better approximation of the data than the usual method. I can't think of any disadvantages...
First you have your data points:

Step 2: Find the centroid of every point with an x coordinate greater or equal to x1. Here there are 6 points on the graph to the right of x1,y1. So I would sum the 6 x values and divide by 6 and sum the 6 y values and divide by 6. This gives x2,y2.
Step 3: Create the line connecting x1, y1 and x2,y2. Line(T)=x1*(1-t)+x2*(t), y1*(1-t)+y2*(t), for t from a to b, you can choose a and b to make the line as long as you want.
This gives C:

This is your regression.
Theorem: This line C balances the points on either side of C.
Proof:You know the left and right sides with respect to x1,y1 balance because x1,y1 is the centroid. x2,y2 is the centroid of all the points to the right or above and below x1,y1.Imagine another point x3,y3 that is the centroid of all the points to the left or above and below x1,y1. x2,y2 and x3,y3 must balance across x1,y1 because x1,y1 is the centroid and all other points balance at either x2,y2 or x3,y3.. This means there is a line through x1,y1, x2,y2, and x3,y3 because if they weren't collinear x1,y1 couldn't be the centroid of all the points. That line must have the property that the centroid of the points on one side of the line reflect across the line to the centroid of the points on the other side of the line because it passes through the 3 centroids balancing all the points.
Theorem: This line C has the shortest total of distances squared to the points as measured by the length squared or quadrance of segments from C to all the points, each perpendicular to C.
Proof: Mirror all the points across C making pairs of points adding new points as necessary, C is still the line of balance because the midpoints of all those pairs still lie on C. This doubles the total distance squared to all the points. Then move every point so they all have the same distance squared to C as the average distance squared to C, this doesn't change the total distance squared and C still balances the points because the midpoint of every pair hasn't changed. For every pair of points, the distance to each from C is the same: a. This minimizes the sum of the distances squared to the two points , because if move the midpoint that is on C, to still balance the points it must be on the line connecting the two, but if we lengthen one distance and decrease the other both by c, to maintain the total distance, we have
(a+c)^2 + (a-c)^2 > 2*a^2
because
a^2+c^2+2*a*c + a^2+c^2-2*c*a > 2a^2
because
2(a^2 + c^2) > a^2
for any choice of c .
So since we can only increase the sum of the distances squared to C in this way, the point on C minimizes the distance squared to each pair of points, which means it minimizes the distance squared to any subset of these points because they all have the same distance squared to C. And the original points are a subset of these points so C minimizes the sum of the distances squared to them.
Comparison to Least squares method on sample data
On here is using Maple's least square method vs. the data:

Here is using this method I made:

The advantage to using mine versus the standard is that mine is simpler to compute running in linear time vs. the standard method has to solve a matrix which can run in somewhat less than O(n^3) time, so it is much faster taking only the cube root of n as much time. My method doesn't require the points to be one to one with the x-axis, and because it uses a parametric equation the best fit to the data could even be a vertical line whereas that would break the usual method. The axioms needed to use my method are simpler to explain as they only involve basic geometrical ideas and not calculus. And at least in this one test it gave a better approximation of the data than the usual method. I can't think of any disadvantages...
Tuesday, October 8, 2013
Beta characteristic and isomorphism
Suppose you have any kind of graph:
 Note that some of the edges are weighted, vertices can be connected to themselves, and it doesn't have to be planar. It could also be a directed graph, where the weight from one vertex to another is considered -k times the weight in the other direction for some constant k. A restriction is that if you are treating graphs with multiple edges between vertexes, the weight needs to reflect the number of edges, for example 3 edges between vertexes could be weight 3, and if it's also a directed graph with multiple edges the edges need to be in the same direction. Maybe it's also worth noting that by these conventions a weighted directed graph where all the weights are multiplied by -1 and all the directions are reversed are considered isomorphic.
Consider the labeling of the vertices for the graph pictured above S1:
 This is a labeling that is the solution to the following equations:
 Every equation is 1 + the sum of the weights of the connections to it's neighbors.
Note that there will always be a solution to this kind of set of equations because these are basically equations for n hyperplanes in n dimensions and it can be seen that none will be parallel because one would have to be a constant plus another but the 1+ on the right hand side prevents that. So the n hyperplanes will always meet at exactly one point, unless it ends up that two or more of the equations were exactly the same, in which case the variables that are free in the set of equations can be set to 0 to get one point.
:
 It is the same equations as before except the non 1+ part on the right hand side is divided by 2. For this graph the solution S2 is:

Basically the 1+ on the right hand side of the equations makes sure that equations 1 and 2 aren't linearly related.
Finally make a matrix whose rows and columns are formed by these solutions S1..SN for a graph of n vertices and sort this matrix by exchanging columns until the first row is in increasing order. This gives you what I call the Beta characteristic B(i, j). Note that however the vertices were named in the original graph yields the same Beta characteristic after sorting.
So for a graph of n vertices, I will claim that two graphs are isomorphic if and only if this Beta characteristic is the same.
proof:
First that a Beta characteristic exists and corresponds to one graph:
Let B be the beta characteristic and m(i,j) be variables.
For a graph of n vertices, there are n^2 equations (i,j) and n^2 variables m(i,j)
B(i, j) = 1+(m(1,j)B(i,1)+m(2, j)B(i,2)+...m(n,j)*B(i,n))/i
All of these equations are linearly independent, because every equation has a constant term of 1, no amount of them added together can equal another. And because only the variable part of each equation is divided by i, you can't multiply any two equations by constants and make the same equation. For any choice of m(i,j) there is a unique Beta characteristic B because the equations with left hand side B(i, x) are n hyperplanes in n dimensional space which meet at only one point. Each such point becomes a row in a matrix and these are sorted to become B. For a choice of B there is a unique solution to the m(i,j)'s because there are the same number of equations as variables and they are all linearly independent. These m(i,j) are translated in a unique way to a corresponding graph. .
Second that isomorphic graphs correspond to one Beta characteristic. Isomorphic graphs are only different in the way the vertices are labeled and any labeling of the same graph results in the same Beta characteristic as the columns of the Beta characteristic are always sorted in increasing order of the first row from left to right.
Consider the labeling of the vertices for the graph pictured above S1:

Note that there will always be a solution to this kind of set of equations because these are basically equations for n hyperplanes in n dimensions and it can be seen that none will be parallel because one would have to be a constant plus another but the 1+ on the right hand side prevents that. So the n hyperplanes will always meet at exactly one point, unless it ends up that two or more of the equations were exactly the same, in which case the variables that are free in the set of equations can be set to 0 to get one point.
:


Finally make a matrix whose rows and columns are formed by these solutions S1..SN for a graph of n vertices and sort this matrix by exchanging columns until the first row is in increasing order. This gives you what I call the Beta characteristic B(i, j). Note that however the vertices were named in the original graph yields the same Beta characteristic after sorting.
So for a graph of n vertices, I will claim that two graphs are isomorphic if and only if this Beta characteristic is the same.
proof:
First that a Beta characteristic exists and corresponds to one graph:
Let B be the beta characteristic and m(i,j) be variables.
For a graph of n vertices, there are n^2 equations (i,j) and n^2 variables m(i,j)
B(i, j) = 1+(m(1,j)B(i,1)+m(2, j)B(i,2)+...m(n,j)*B(i,n))/i
All of these equations are linearly independent, because every equation has a constant term of 1, no amount of them added together can equal another. And because only the variable part of each equation is divided by i, you can't multiply any two equations by constants and make the same equation. For any choice of m(i,j) there is a unique Beta characteristic B because the equations with left hand side B(i, x) are n hyperplanes in n dimensional space which meet at only one point. Each such point becomes a row in a matrix and these are sorted to become B. For a choice of B there is a unique solution to the m(i,j)'s because there are the same number of equations as variables and they are all linearly independent. These m(i,j) are translated in a unique way to a corresponding graph. .
Second that isomorphic graphs correspond to one Beta characteristic. Isomorphic graphs are only different in the way the vertices are labeled and any labeling of the same graph results in the same Beta characteristic as the columns of the Beta characteristic are always sorted in increasing order of the first row from left to right.
Monday, October 7, 2013
Making a rectangle map
So you start with a random map:
 Then connect vertexes on the map with straight lines instead of irregular ones, but make sure every region has at least four sides.


Move vertices so every line that is closest to horizontal becomes totally horizontal, same with lines that are closest to vertical, and the rest make 45 degree diagonals.

Imagine the diagonals are the hypotenuse of a right triangle, replace the diagonal with the other two sides of the triangle...

Move vertical and horizontal lines into as few columns and rows as you can while preserving the borders...

This still has the same border information but everything is on a grid....
Can every map be put into grid form? I don't know...
Sunday, October 6, 2013
Cubic sections
I noticed that you can plot the surface of the cone that they use in describing conics as:


I don't know why maple didn't show points close to the origin but they would just follow the same pattern of smaller circles.
So an easy proof that the degree 2 equations are conic sections is suppose you were solving the following two equations, the first for this cone and the second for the plane.
You could in solving these equations add equation 2 to equation 1 and solve equation 2 for z to get these 2:
Then you could plug the expression for z in equation 2 in for z in equation 1

Since a,b,c,d were arbitrary we can group like terms and rename the constant part multiplying each term to f,g,h,j,k,l:
Which is just the general quadratic equation. So the plane intersecting x^2+y^2-z^2=0 are general quadratics, or they could be called conic sections as I wanted to prove.
Now maybe the more interesting thing is that the same reasoning applies equally well to a surface x^3+y^3-z^3=0 intersecting with a plane. It looks like:

Sections of this surface are apparently the cubic sections. Also I believe the reasoning could apply to more variable, but hyperplanes intersecting higher dimensional surfaces.
Thursday, October 3, 2013
Cooling matrix revisited
I noticed if you have a grid of temperatures matrix T like:
 The diagonal ellipses are meant to imply that the grid can go on to any number of rows and columns...
I found this matrix A:

which is meant extend to however large the temperature grid is. If your temperature gird is at time t then this formula:

finds the temperatures in your grid after 1 second where k is the usual physical coefficient in Newton's law of cooling. It works best if the area you are concerned about is far enough from the boundary of the temperature matrix that the values in the first and last column and row of the matrix don't begin to affect the area you are looking at.
Reasoning:
Look at what happens to a cell T[i,j](t) in the temperature matrix at least one row or column away from the edges of the matrix. After applying the formula the value in that cell becomes:
T[i,j](1) = k*(T[i,j](0) - (1/4)*(T[i-1,j](0)+T[i+1,j](0)+T[i,j-1](0)+T[i,j+1](0)))
So the temperature changes by a proportion k times the difference between the temperature of the cell and the average temperature of the cells around it. This is exactly as it should be by Newton's law of Cooling.

I found this matrix A:

Reasoning:
Look at what happens to a cell T[i,j](t) in the temperature matrix at least one row or column away from the edges of the matrix. After applying the formula the value in that cell becomes:
T[i,j](1) = k*(T[i,j](0) - (1/4)*(T[i-1,j](0)+T[i+1,j](0)+T[i,j-1](0)+T[i,j+1](0)))
So the temperature changes by a proportion k times the difference between the temperature of the cell and the average temperature of the cells around it. This is exactly as it should be by Newton's law of Cooling.
Wednesday, October 2, 2013
fertilizer from sunlight
So I thought, have a pond that grows algae, the algae use water and sunlight to create carbohydrates, feed the algae and water to a tank of yeast, the yeast eat the carbohydrates and produce alcohol, keep the alcohol and feed the dead yeast to bacteria, the bacteria eat the dead yeast to produce methane, keep the methane, and the dead bacteria can be used as fertilizer for plants. So from sunlight and water you get alcohol and methane some of which is used as fuels to drive the pumps that feed from one tank to another and you end up with fertilizer.
separating noise from information in a picture
Suppose you have a picture like:


It seems to work as an edge detector...

It's easy for a person to tell where the two interesting objects are in this picture but I found a way for the computer to do it as well.
Step 1: Make a new image where you look at each pixel in the original image and add up how far it's value is from it's neighbors. If it is exactly the same color as all it's neighbors that is a 0 if every surrounding pixel is exactly the opposite color that is a 255 (this means white in computer graphics).

This has the effect of making all contiguous areas of color or gradients solid black.
Step 2:Make a new picture where the new pixels are the average of the old pixels and their neighbors. Sort of a blur.

Step 4. Blur again but only keep pixels that are between 0 black and 128 grey, everything else is made white.

Now do the same thing again but only keep pixels that are between 0 black and 64 grey. All else stays white.

Now you should have a nice binary map of where the interesting parts of the original picture are with the noise removed.
So it's kind of interesting to see what this process does to normal pictures...


Tuesday, October 1, 2013
3d keyboard
My idea was that there would be this ball with buttons on it for all the keys on a keyboard inside each triangle and the triangles stick out a bit so you can hold it easily without pressing any on accident, you press inside each triangle for the key and a little harder to do shift+the key. So you could type using only one hand while the other one does the mouse is the idea. I don't know what the learning curve would be like or if people could get pretty good at it or whether it would just drive anyone insane that tried to use it lol.

 maybe a better idea than the last thing, this is a ball you hold in your fist so your fingertips are on the five buttons, and it has a gyroscope in it so it can tell which way you are holding it in space like an ipad. And depending on which way you rotate it, it changes what the five buttons do.Like in one position the five buttons could be e,t,a,o,space, and if you rotate it a bit in a certain direction they change to n,s,h,i,backspace.


Subscribe to:
Posts (Atom)