analytics

Saturday, April 19, 2014

Beta sub t, binary comparison between x and y

I've defined this function:


Where x and y are binary variables. And mod indicates the remainder of it's first argument when divided by it's second. The interesting thing about this function is to consider a certain truth table between x and y:


This could be considered !(x xor y) in the usual computer terminology, thought that starts to show how confusing the naming can be.
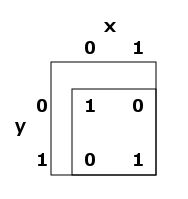
To see what Beta(t) does first look at the truth table read across as rows 1 0 0 1, this is the binary number 9, so we have:

First look at the function at x=0 and y = 0, the percent sign means maple uses the last result in place of the percent sign:
In general this Beta function at t produces the 0-15th truth tables for comparing x and y.  So to get the truth table that reads across by rows as 1 1 0 0, that is 12 in binary so you would look at B(12) at x = 0..1 and y = 0..1
**Explanation**
Note that the function in x,y over x=0..1 and y=0..1 is:
19*t+19 for t = 0..15:
19
38
57
76
95
114
133
152
171
190
209
228
247
266
285
304
These numbers above mod 17
2
4
6
8
10
12
14
16
1
3
5
7
9
11
13
15
Then the above mod 2:
0
0
0
0
0
0
0
0
1
1
1
1
1
1
1
1
The other four squares in the matrix go 0000111100001111, 0011001100110011, and 0101010101010101
so you get every combination in order...for example the 13th place in each of these four binary numbers is:
1,1,0,1 or 1101 which is the number 13 in binary...


Thursday, April 17, 2014

modular additive network

Suppose you have a graph like the following:
I first fill in some starting values for all the nodes:
Call this State 1. State 2 is generated by adding the values of all nodes connected to a node and itself, then modding by a certain amount and adding 1. So if the mod amount is 7. The node with a 3 in state 1 would add 3+6+2 = 11, 11 mod 7 = 4, 4+1 = 5. so State 2 would have a 5 where the 3 is now.

It's interesting how long it takes to repeat the initial state, here are the first few States...
[2, 5, 2, 5, 6, 3]
[7, 1, 5, 5, 5, 5]
[3, 5, 3, 5, 7, 2]
[3, 3, 7, 7, 7, 6]
[7, 7, 6, 7, 3, 7]
[3, 7, 3, 4, 3, 3]
[7, 4, 6, 4, 3, 3]
[4, 1, 3, 5, 3, 6]
[3, 7, 4, 7, 1, 6]
[2, 1, 1, 5, 1, 5]
[4, 3, 4, 3, 1, 1]
[2, 1, 7, 5, 7, 7]
[2, 2, 4, 2, 1, 1]
...
This particular configuration repeated every 159 states. It's interesting that changing the initial values of all the nodes to some other number less than 8 for M = 7 still repeats after 159 iterations. Different M values repeat after different amounts of iteration, like M=11 repeats after 189...
source code:
graph = [[0,1,1,1,1,0],[1,0,1,1,0,0],[1,1,0,0,1,1],[1,1,0,0,1,0],[1,0,1,1,0,1],[0,0,1,0,1,0]]
amountsold = [7,5,3,5,4,3]
a = [7,5,3,5,4,3]
def add(graph, amounts):
    amountsnew = []
    for i in range(0, len(graph)):
        amount = amounts[i]
        for j in range(0, len(graph[i])):
            amount += graph[i][j]*amounts[j]
        amountsnew.append(amount%11+1)
    return amountsnew
print amountsold
for i in range(0, 1000):
    amountsold = add(graph, amountsold)
    if amountsold == a:
        print(i)

Thursday, April 3, 2014

Alternative to Fourier Transform

I noticed if you have a plot, like this:
you can easily find some frequency information with this formula:
Where d is the number of divisions of the interval you want to analyze and r /d is the rightmost point... a slight modification could be made to shift the interval being analyzed from starting at 0. 
So for the values from the first image, with x of 100 and d of 10, if we vary s we get:

It appears the most interesting values are 2.5, 3, and 4.75... the original function I used to generate the data points was in fact:
The reason it works is pretty simple, no matter what your original wave is, if you add it together with a simple sine and cosine wave at a particular frequency and take the absolute value as per the formula, the result will be much larger on average over the interval if the original wave contains that frequency, as the waves "resonate" and reinforce each other making a larger value over the interval.
It seems much simpler than the Fourier transform, though it is somewhat less exact because there is noise in the result potentially making it more difficult to find the peaks.