So this formula gives 100% and -100% in those two extreme cases and also a value to every intermediate case.

Where P[i,1] and P[i,2] are the position of item i on list 1 and list 2 respectively.
The part in red sums the squares of the difference between where each item appears on list 1 and where it appears on list 2. The blue part is what the sums of the squares of the differences would work out to if the two lists were in complete reverse order from each other, which also is the maximum the part in red can reach. So the red part divided by the blue part is a number from 0 to 1 where 0 is the two lists are in the same order and 1 is for when the two lists are in reverse order from each other.
The rest reverses and scales the result between -100 and 100 with -100 being the lists are in reverse order to each other and 100 being the lists are in the same order, with perhaps many values in between.
**Example
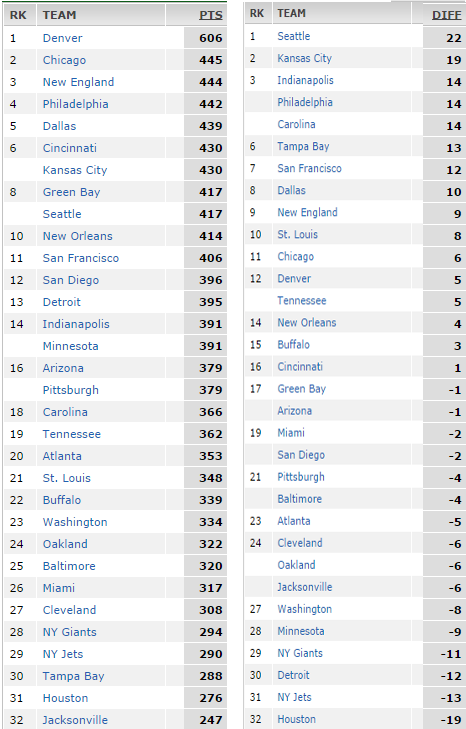
Consider the same graphic which lists how many points a football team in the NFL scored over last year and the difference between the number of turnovers they gained and how many they lost.
First we go through every team, and sum the squares of the differences for where they appear on each list. For example, the Denver Broncos are number 1 on the left list and 12 on the second so that is (12-1)^2=121. We do this for every team and add them all. The sum over all is 2298, and the blue part (an n of 32) of the formula is 10912, so plug those in the formula to get a correlation score of 57.8%, which is well towards a positive correlation on the scale of -100..100 so over a season a higher turnover differential correlates well with a higher point total.
** I think the nice thing about this method is it should detect any type of correlation, not just linear, because it doesn't depend on the values of the variables themselves just the order... I think this would be a good initial test for any type of correlation and then you would use the conventional methods for determining which type of correlation, log normal, linear, etc..
No comments:
Post a Comment