
Tuesday, May 8, 2012
180 degree picture


Monday, May 7, 2012
Hexagon based font with systematic kerning
The letters:


There are several categories of letters:
These letters use only the middle of their respective hexagon:
1. A,E,F,H,I,J,K,L,M,N,T,U,U,V,W,X,Y,Z
1l. h,i,j,k,l,m,n,t,u,v,w,x,y,z
These letters use the middle and right portions of their hexagon only:
2.B,D,P,R
2l.b,p,r
These use the middle and left only:
3.a,d,f,g
These use all the hexagon:
4.C,G,O,Q
4l.c,e,o,s
Now an example of them together in print:

For spacing between letters:
The rule is there is a third of a small hexagon worth of space between each pair of letter's furthest extents except no extra space is required between two letters furthest extents that would directly touch. Like for instance between the e and r in "Over" the e takes up the whole hexagon and the r only uses from the middle rightward. So the left portion of r's hexagon makes up the spacing between the two. But between the D and o in Dog, the D uses the right portion of its hexagon and the o the left part of its but no extra space is needed.
For spacing between words:
There is either a whole small hexagon between the last letter of a word that uses the right side of its hexagon and a letter that uses the left side of its hexagon, as in between the e and Q. Or 1/2 of a small hexagon and a third of a big hexagon, as in between n and F, x and J, etc..
Tuesday, May 1, 2012
Recursion notation
This is meant to be a notation for doing any operation recursively.
An example:


An example:
Or this one equals the golden ratio:

This one is pi-3:

This one is just equivalent to the usual sigma notation for adding over an index:

Anywhere you see a ... you just recurse using the index, thus it handles the job of sigma and pi, as well as the continued fractions examples. When the index runs out it just fills in the expression as it would be without the ... For example this gives 1.6:

Even with this some continued fractions would be cumbersome, so you can combine with Lagrange's notation:

I thought of using the colon to indicate that after recursing the specified number of times the last ... is replaced with a specific value.

Elementary Parameterization of shapes made of straight lines
First I'd like to introduce this function I made that I call T(p). Here's it written out in full with a couple of graphs for different p values.
 The gist of the function is that is 0 everywhere except from p-1 to p+1, where it linearly rises, peaks at a height of 1 and then falls back to 0.
It's a fairly big function but it is easy to calculate and it is made up of only elementary operations, and it's behavior is useful for a lot of applications that I can think of. Here's one example:
Suppose you have these 6 [x,y] points:
[1,1], [6,3.5], [0,3.5],[5,1],[3,5],[1,1]
You can make a function that connects each of these with a straight line between them over time. You make a parametric function:
 See how x(t) is basically just T(1..6) times each x coordinate in order? And the same for y(t). Here's the graph, you can imagine if t were going from 1 to 6 it would be drawing this out animated instead of one picture.
 Now I realize if each T(p) were written out instead of using this notation this function would be hideous looking but it is still an elementary parametric equation there are just a lot of elementary operations.

It's a fairly big function but it is easy to calculate and it is made up of only elementary operations, and it's behavior is useful for a lot of applications that I can think of. Here's one example:
Suppose you have these 6 [x,y] points:
[1,1], [6,3.5], [0,3.5],[5,1],[3,5],[1,1]
You can make a function that connects each of these with a straight line between them over time. You make a parametric function:

Sunday, April 29, 2012
Deterministic generation of normally distributed values
I thought of this way to generate a series of numbers with a normal distribution without using any random numbers. First of all consider the numbers 10*pi, 100*pi, 1000*pi, etc... if you consider just the decimal part of each of these they vary uniformly between 0 and 1. *This hasn't been proven but it is believed to be true* Also consider 10*e, 100*e, etc.. with the same notion in mind. I wrote a floor function previously that I'll be using for this post. Then all that remains is plugging those for the two variables U and V into the box-muller transform.
Now my final equation is:
 The values for t=1..10:
0.5426654684
0.9042166471
-.2031938572
.1624766993
0.6677675887
0.4311350734
-.1788312781
0.8176724812e-1
-.4680815243
1.275914647
...
it could generate numbers forever but I believe they will tend to a normal distribution. Either that or pi and e aren't as random in their decimal digits as they seem, either way I find it interesting.
Now my final equation is:

0.5426654684
0.9042166471
-.2031938572
.1624766993
0.6677675887
0.4311350734
-.1788312781
0.8176724812e-1
-.4680815243
1.275914647
...
it could generate numbers forever but I believe they will tend to a normal distribution. Either that or pi and e aren't as random in their decimal digits as they seem, either way I find it interesting.
Monday, April 23, 2012
Square Map


Sunday, April 22, 2012
2nd order interpolation
You start with a collection of heights or intensities that you want to find an equation for:
 You find an interpolation for each row:
 Notice the 3 equations are of a similar form but they differ in the coefficients. My idea is to interpolate the 3 related coefficients in the y direction. Like the *x^2 coefficents are -3/2, 1/2, -7/2 so we can find the equation in y that produces those 3 values where we want them to occur on the y axis...

Then for the other 2 coefficents...
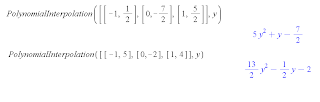 Then make one big equation substituting the equations in y for the coefficients of the basic formula:


Then for the other 2 coefficents...


That's the same equation I got doing it the other way in yesterday's post!

This goes smoothly through the specified grid of z values.
Subscribe to:
Posts (Atom)