analytics

Saturday, August 31, 2013

solving for the graceful graph

Suppose you have a simple graph like so:

And what you'd like to know is whether there is a way to label the vertices with integers so that the difference between every connected vertex is one of the natural numbers up to the number of connections. For example in this graph we would want the differences between vertices to be 1,2,3,4,5,6,7.
I'm imposing a further restraint that we want want vertex to be labeled 0, and the highest labeled 7.
So two are 0,7 we could guess they could be 0,1,2,3,7. With these numbers every natural number difference up to 7 is possible.

We could brute force the solution by trying every possibility but this goes up with factorial complexity so I found a way to solve them directly.
Consider the following system of equations and the solution (which Maple found in a fraction of a second)
The first equation is basically following from we know what we want the vertex labeled. The last equation is stating that the differences squared because we don't want the order to matter add up to the first 7 natural numbers each squared. And the middle equations I use the trick of raising each vertex to different powers so that we can have 5 different non-linearly related equations. As you can see this outputs four possible solutions which each work to fill out the graph.
The first one is:
See that this satisfies the objective. Later I will update with more information on exactly how fast the computer is able to solve these as the vertex size goes up...


Wednesday, August 28, 2013

Nested focusing parabolas

Doge Dish

All the light coming in from x=4.5 to 10 gets focused to a spot about .1 across.
I figured it out with a great program geogabra.. this is how it looks in the program:
as you slide the slider in the top left from 10 to 4.5 the spot E on the x axis moves very little, over a range of .1.
Now because it can't be revolved around the focal point without self intersecting you would have to do partition the revolution so that alternating pieces around the perimeter are one of these curves then the other.
Then I figure from the area of light reflected to the spot it would reflect on this array has an amplification of around 3000x...


Thursday, August 22, 2013

parametrization of quarter circle and higher dimensional similar curves

It's easy to see by plugging into x^2 + y^2=1 that these two expressions in t satisfy the relationship.
Also changing the square roots in the parametrization to say, cube roots satisfies x^3+y^3=1

Thursday, August 15, 2013

Examining the delta characteristic

A month ago or so I defined on my blog that the delta characteristic for a graph such as:
will be the solution to the set of equations of the form:
For example the first equation is A=(B+E+F)^(1/2) because A is connected to B,E, and F. 
Notice that the solution's for A and F are the same and B and D are the same. And that the graph  is symmetric with respect to A and F and also B and D.
But since the labeling of the graph is arbitrary, I usually write the delta characteristic as an ordered list of solutions:
{2.452592664,3.007605387,3.007605387,3.098500103,3.098500103,3.494597399}


I've proven by exhaustion* that for simple graphs of 5 vertices this delta characteristic is different for any two graphs that are not isomorphic. And that it is the same for graphs that are isomorphic. But I'd like to know if this is true in general, if this is always a way to test for isomorphism of graphs.


* Proof by exhaustion for the case of 5 vertices:
G1:  1     1     1.259 1.259 1.587
G2:  1     1     2     2     2
G3:  1.341 1.341 1.799 1.799 1.897
G4:  1.375 1.484 1.484 1.892 2.205
G5:  1.587 1.587 1.587 1.587 2.519
G6:  1.587 1.587 2.245 2.52  2.52
G7:  1.673 1.673 2.246 2.246 2.799
G8:  1,406 1.979 2.161 2.161 2.510
G9:  1.415 2.005 2,259 2.505 2.601 
G10: 2     2     2     2     2
G11: 1,640 2.368 2.692 2.804 2.804 
G12: 1.751 2.425 2.425 2.814 3.068
G13: 2.213 2.213 2.318 2.686 2.686
G14: 2.289 2.289 2.289 2.620 2.620
G15: 2.314 2.314 2.314 2.314 3.042
G16: 1.823 3.079 3.079 3.079 3.326
G17: 2.579 2.579 2.579 3.326 3.326
G18: 2.400 2.881 2.881 2.952 2.952
G19: 2.503 2.503 2.961 2.961 3.306
G20: 2.667 3.213 3.213 3.556 3.556
G21: 3.130 3.130 3.130 3.130 3.538
G22: 3.368 3.368 3.781 3.781 3.781 
G23: 4     4     4     4     4
(All possible simple graphs have a different characteristic... )

**Questions**
Now clearly all variables being equal to 0 is one solution to this type of system of equations.  But is it true that there is always one other solution that takes the form of positive values for all the variables? It is clear that there are always going to be the same number of equations as variables and that no one is a linear combination of any number of others or a constant multiple of another...

Thursday, August 8, 2013

Test for graph isomorphism

I noticed if you translate 2 graphs into an connectivity matrix like so:

These two graphs are obviously isomorphic as I've just relabeled the graph. But I've found that perhaps this can be captured by this relationship I've found of their connectivity matrices:

What I'm showing is that if you multiply the adjacency matrices and then multiply then changing the order of the multiplication (because matrix multiplication isn't commutative), you produce two matrices that are the transpose of one another. 

**EDIT**

I actually found counterexamples that suggest that any time you multiply both ways two valid connectivity matrices that meaning that they have the symmetry that the ith row and jth column and the jth column and ith row are the same, you end up with transposes, so it doesn't point out that they are isometric after all. 


Thursday, August 1, 2013

Estimation of Gauss's circle problem

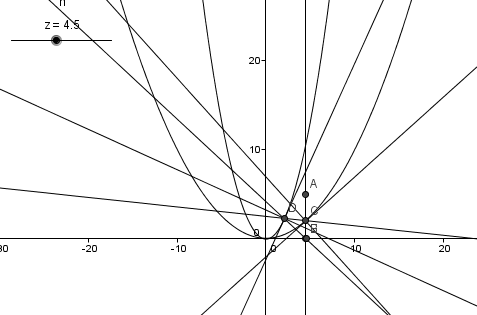
Gauss's circle problem asks how many grid points are inside a circle of a certain radius, like here we have a circle of radius 8 and if you count the number of points lying exactly on the circle and inside you find that there are 197.
A list of the first 46 such numbers and a plot:
Now I've found this function that closely approximates this curve:
For instance a circle with radius 46 has 6625 points inside it and on the boundary, my formula gives: 6650. So within a couple thousands of a percent of the true value.

**Derivation**
I start with a couple of assumptions, that the number of points actually on the circumference of the circle goes up exactly as the radius. This is not exactly true but close enough to give the result I wanted. Also that these points can be approximated by a n-gon where n is the radius. For example here is the circle of radius 8 and the octagon I use to represent the number of points on the circumference of the circle....

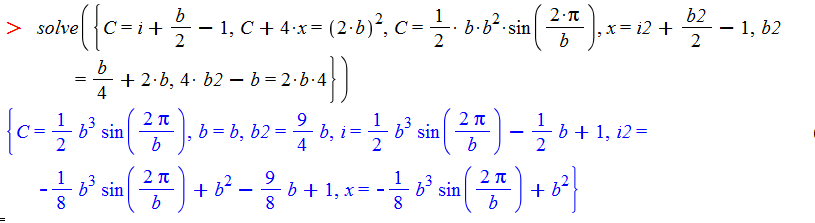
Now I arrived at this set of equations and their solution:

I'll number and expalin each:
1.Pick's Theorem: that the area of the n-gon is equal to the number of grid points in the interior of the n-gon, i, plus half the number of points on the boundary b -1.
2. The area C + 4*x where x is each corner area outside the polygon but inside the square is equal to twice the radius squared for the area of the whole square.
3. The third is saying that C the area of the n-gon related to the number of points on the boundary and the radius (both represented by b because remember I assume the number of sides of the n-gon, and the radius are the same) and using the usual formula for the area of such a polygon.
4.An equation for x, the area in one corner outside the n-gon. Introducing i2 for the interior of this region, b2 for the border, and using picks theorem again.
5. This follows from the fact that b and b2 share a common border and that if you if you subtract one quarter of the inner border from outer you are left with just the semi perimeter of twice the length of the square.
6. That 4 times the border of the corner polygons minus the border of the n-gon is 8 times the radius, or the perimeter all the way around the square.

So the solution gives an expression for i  which is the number of interior points, to which for the final equation I add one b so it becomes an expression for the interior plus the points on the border,  and we give the equation b the radius and it ends up closely estimating the number of grid points within and on the border of the circle.