analytics

Wednesday, May 16, 2012

Game of area

I thought of this game, where you both start off controlling a half of the board like so:

And the players take turns picking points on this grid, and any point on the grid that is closer to one of the red player's points than any of the blue player's points gets colored red, and vice versa. Any point that is equally close is grey and doesn't count for either player.

So here might be the first few moves of a game on an 800 by 800 point board:
Red(133,133)
Blue(470,200)
Red(500,160)
Blue(750,100)
Red(50, 200)
Blue(744, 50)
Red(150, 200)

After those moves the board would look like:
I chose those moves kind of randomly but I think you get the idea. 


Constructing borders between points

I found if you have a collection of randomly distributed points a way to logically construct borders between them. Say these are the points:
First you construct lines halfway between the points like so, these four lines are halfway between the point in the middle and each of the surrounding points. Basically you draw a circle with the center at one point, and extending to another point and do the same starting at the second point, then connect a line between where those circles intersect. They form four new points at intersections of lines I'll call a,b,c,d that form a four sided figure:
When you continue on this process you will notice that the line halfway between two of the other points crosses through the four corners of the polygon you had already made. 
So then cleaning up you end up with:

Tuesday, May 15, 2012

Rotating f(x)

I don't know if this is really that interesting but it just occurred to me that if you have some function, let's call it f(q).
You can do the following to make a parameterized curve of this parabola rotated any angle. 

here the parabola is rotated by 45 degrees clockwise. There are different operation to scale the function, or skew it or flip it various ways and a lot of functions are related visually that way.

Monday, May 14, 2012

Visiting each of a number of points on a circle

For twelve points on the circle you can move 5 steps around each time and visit every point once and end up back where you started. This is because if the points are labeled 1 through 12:
(5*n+1) mod 12: n=0..12 = [1,6,11,4,9,2,7,12,5,10,3,8,1]

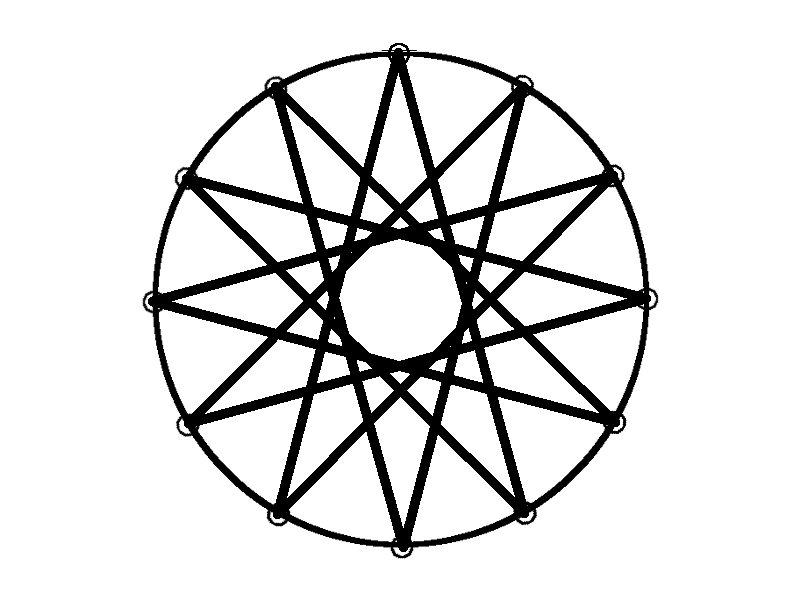
For 14 points 5 works as well:
(5*n+1) mod 14: n=0..14 = [1,6,11,2,7,12,3,8,13,4,9,14,5,10,1]

For 16 points:
(5*n+1) mod 16: n=0..16 = [1,6,11,16,5,10,15,4,9,14,3,8,13,2,7,12,1]

20:
(5*n+1) mod 20: n=0..20 = [1,6,11,16,1x

So maybe it always happens when they don't share a factor:
For 14:
(3*n+1) mod 14: n=0..14 = [1,4,7,10,13,2,5,8,11,14,3,6,9,12,1]

but (6*n+1) mod 14: n=0..14=[1,7,13,5,11,3,9,1x

So my conjecture is this type of drawing can be made when:
(s*n+1) mod C: n= 0..C = [every possible remainder once then repeat]
for s and C coprime. 

Saturday, May 12, 2012

hand logarithmic spiral

This logarithmic spiral shows up everywhere in nature but I think I might be the first to notice it in the hand.

Thursday, May 10, 2012

Estimating square roots, generalized continued fraction expression for every square root

If you look at this formula:
You can see that this equation always holds no matter the a. So you can do something like the following to figure out the square root of a number, here for example is finding the square root of 10 using the top formula:

The two sides will equal exactly when you iterate an infinite number of times substituting in what is already on the right side for the square root of 10 that appears on the right side. The above is 6 iterations and shows that square root of 10 is somewhere near: 3.0983... which is close to the real value of 3.162...


Thus there is one general continued fraction expression for every square root.

Normally the discussion of continued fractions explores each square root as having a different form, such as on wikipedia http://en.wikipedia.org/wiki/Square_root


The have tables of how this looks for every different possible square root:

But this idea I've had gives the same form for every square root.

Wednesday, May 9, 2012

Stock market as a combination of waves

I had this idea that the price of a stock reflects the fact that people are trying to buy it when the price is low and sell it when the price is high. Fewer and fewer people buy it as the price rises until eventually at it's peak more people start to sell it than buy it and the price begins to go down. This is starting to sound like sin(t) behavior or a wave. In calculus terms the change of rate that people are buying the stock is negatively proportional to the price of the stock, just as the second derivative of sin(t) is -sin(t).
  But there are many different agents who have different evaluations of what is considered a "high" price and a low price so the overall stock price should be built from a bunch of sin waves of different shapes. In math when we want to handle this kind of thing we use Fourrier analysis. 
  Here is a graph of Apple's stock price over a year. 
See it looks very chaotic but when you run it through Fourrier analysis it comes out like:
Now the interesting thing is this above function shouldn't be too hard to find a function that matches it. In Maple I find:

I haven't put it through Fourier transform software to see how well this predicts the variation of the price over time yet, though.
The long and short of this whole thing is if you took 234^(1/f) and did the inverse Fourier transform on it, that should be a function that more or less looks like Apple's stock price over time.


Tuesday, May 8, 2012

180 degree picture

The idea is you photagraph the area with the camera pointing straight forward, 45 degrees to the left and 45 degrees to the right, then do a perspective shift on the left and right to match them up. The problem you can see in the one above is the camera autocorrected for the lighting so the one towards the bright light became darker and away from it became lighter. I think it would work the best with a very evenly lit room with no excessively bright spots.

Monday, May 7, 2012

Hexagon based font with systematic kerning

The letters:


There are several categories of letters:
 These letters use only the middle of their respective hexagon:
1. A,E,F,H,I,J,K,L,M,N,T,U,U,V,W,X,Y,Z
1l. h,i,j,k,l,m,n,t,u,v,w,x,y,z
These letters use the middle and right portions of their hexagon only:
2.B,D,P,R
2l.b,p,r
These use the middle and left only:
3.a,d,f,g
These use all the hexagon: 
4.C,G,O,Q
4l.c,e,o,s

Now an example of them together in print:
For spacing between letters:
The rule is there is a third of a small hexagon worth of space between each pair of letter's furthest extents except no extra space is required between two letters furthest extents that would directly touch. Like for instance between the e and r in "Over" the e takes up the whole hexagon and the r only uses from the middle rightward. So the left portion of r's hexagon makes up the spacing between the two.  But between the D and o in Dog, the D uses the right portion of its hexagon and the o the left part of its but no extra space is needed. 

For spacing between words:
There is either a whole small hexagon between the last letter of a word that uses the right side of its hexagon and a letter that uses the left side of its hexagon, as in between the e and Q. Or 1/2 of a small hexagon and a third of a big hexagon, as in between n and F, x and J, etc.. 


Tuesday, May 1, 2012

Recursion notation

This is meant to be a notation for doing any operation recursively.
An example:

Or this one equals the golden ratio:
This one is pi-3:
This one is just equivalent to the usual sigma notation for adding over an index:
Anywhere you see a ... you just recurse using the index, thus it handles the job of sigma and pi, as well as the continued fractions examples. When the index runs out it just fills in the expression as it would be without the ...  For example this gives 1.6:
Even with this some continued fractions would be cumbersome, so you can combine with Lagrange's notation:
I thought of using the colon to indicate that after recursing the specified number of times the last ... is replaced with a specific value.


Elementary Parameterization of shapes made of straight lines

First I'd like to introduce this function I made that I call T(p). Here's it written out in full with a couple of graphs for different p values.
The gist of the function is that is 0 everywhere except from p-1 to p+1, where it linearly rises, peaks at a height of 1 and then falls back to 0.

It's a fairly big function but it is easy to calculate and it is made up of only elementary operations, and it's behavior is useful for a lot of applications that I can think of. Here's one example:

Suppose you have these 6 [x,y] points:
[1,1], [6,3.5], [0,3.5],[5,1],[3,5],[1,1]

You can make a function that connects each of these with a straight line between them over time. You make a parametric function:
See how x(t) is basically just T(1..6) times each x coordinate in order? And the same for y(t). Here's the graph, you can imagine if t were going from 1 to 6 it would be drawing this out animated instead of one picture.
Now I realize if each T(p) were written out instead of using this notation this function would be hideous looking but it is still an elementary parametric equation there are just a lot of elementary operations.